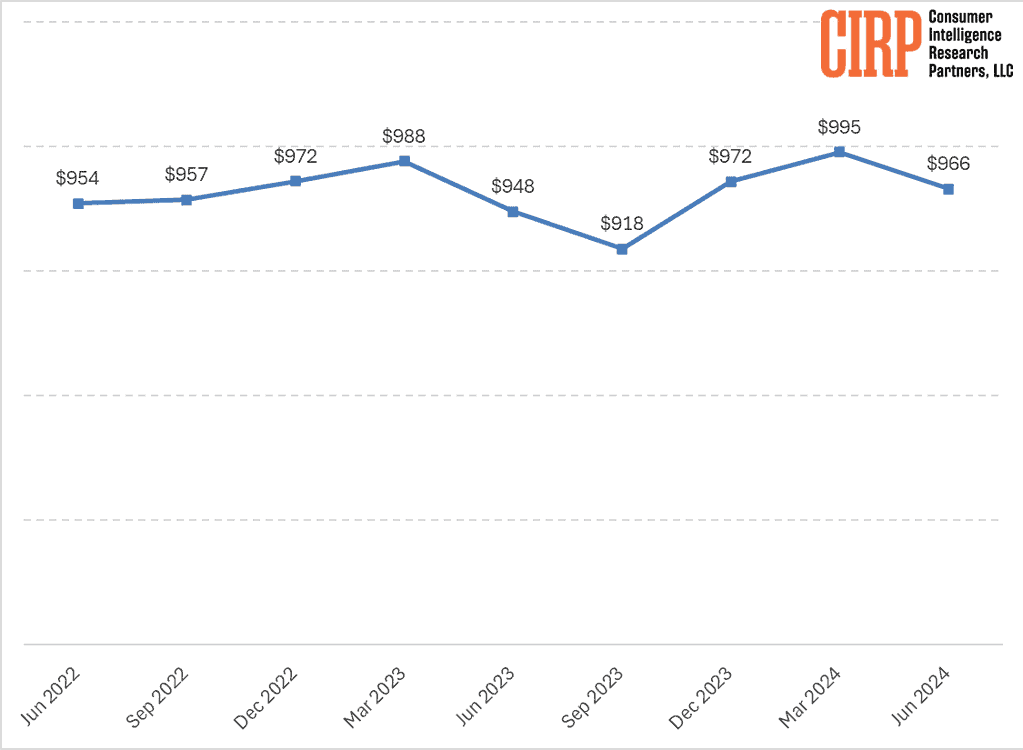
A recent analysis by CIRP suggests that Apple had a weak sales quarter for iPhones. The study looked at US-WARP (Weighted Average Retail Price), a metric tracking the average selling price in the United States. US-WARP declined in the June 2024 quarter compared to the previous quarter. Here is the average iPhone price graph.

Troughs: The lowest WARP was recorded in September 2023 at $918.
Recent Trend: WARP slightly decreased from March 2024 ($995) to June 2024 ($966).
In the June 2024 quarter, US-WARP was $966, down from $995 in the March 2024 quarter but up from $948 in the June 2023 quarter, which was similarly down from the March 2023 quarter. The March 2024 US-WARP was the highest that CIRP had ever estimated.
There are two main reasons for the decline in US-WARP.
- There has been a shift towards older, cheaper iPhone models. This is likely due to a higher percentage of Android switchers, and fewer repeat iPhone buyers in the June quarter. Here is a detailed analysis of this. Android switchers tend to start in the Apple iPhone ecosystem with more straightforward, cheaper models.
- The iPhone launch calendar also plays a role. By the June quarter, most dedicated iPhone upgraders have already made their purchase. So, the remaining buyers are less likely to be interested in buying the latest and most expensive iPhones, given that the next model is almost here.
The decline in US-WARP is not necessarily a bad thing for Apple. It could simply mean that Apple is selling more iPhones overall, just not the latest ones. This makes sense, given that significant upgrades are coming each year, not just on iOS but also Android. This makes it easier to opt for older versions, as the price would be much less than the latest version.
What’s your take on this average iPhone price graph?
More here.
