Perspectives
Here at The Mac Observer we’ve covered events such as those described. The thing to remember, however, is that:
- Not every failure occurs on every iPhone. Issues, especially those relating to software, tend to be sporadic, are rare, and often go unexplained. User behavior and habits are often pointed to in the analysis.
- These failures have to be put into context as 1) a percentage of the whole population and 2) relative to each other over time.
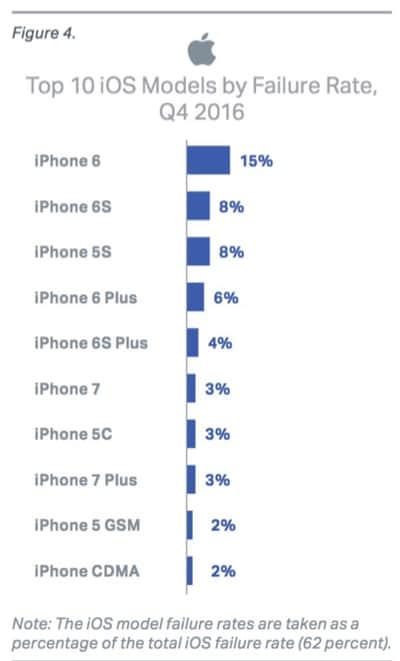
In that regard, looking at what is to be sure, a sample, and comparing across models is valuable. For example, using consistent standards for “failures” which iPhones fare the worst? That’s a helpful question. Here’s what the report found.

The report goes on to look at Android phones and finds that, like the iPhone 7, failure rates went down. I won’t go into the Android analysis here; you can read the report for yourself. But it’s of interest to note that for a block in time, the iPhone 6 era, these failure rates were going up with iOS devices and down with Android. There’s no way to predict if that trend will continue.
Back to the iPhone/iOS devices. Aside from frequently crashing apps after a major software update, customers frequently reported problems with:
- Apple’s ear pods fail to work for a phone call, requiring a restart of the call.
- Spotty Bluetooth connectivity
- Unexplained battery depletion after an OS update with attendant battery overheating.
The Good News
The thing to remember, amongst all the numbers and charts, is that any electronic device is going to have minor issues. The question to ask is how pervasive are the problems and how unhappy are the customers as a whole? For example, the iPhone consistently scores very high in J.D. Power satisfaction studies.
Finally, when an identifiable problem crops up, as with the loose lens in the iPhone 6, it gets fixed under warranty—or AppleCare+.
I came away from this report feeling that Blancco had done a pretty good job cataloging the kinds of problems that customers are having when they bring their smartphone in for some problem. And they did a good job comparing the problems across several generations of iPhone models. And against Android for a short period of time.
However, one still has to understand what’s meant by “failure rate” and then dig pretty deeply with an analysis of the analysis to put it all into perspective.

When looking at data like this it must be kept in mind whether there are special circumstances that could have caused deviations in each group, and how those deviations were treated in the analysis. For example, Apple and Samsung both had battery extended warranty/ recall events recently. In Apple’s case they replaced the battery in customer’s phones, which I’m sure was treated as “an issue customers could not fix themselves” by the survey. In Samsung’s case they were forced to pull the phones off the market and refund people’s money. It is unclear how the survey would have handled that. We do know that the Samsung recall involved a lot of phones, so Having the Android reliability statistics go up during that period suggests the incident was excluded.
Also, in Apple’s case I’m sure a lot of phones on the battery replacement program list were working to the customer’s satisfaction were only brought in for “preventative maintenance” to avoid potential future issues (I know that was true in my case).
Not surprisingly, exclusion from the analysis of a large forced safety recall for one platform and inclusion of encouraged preventative maintenance for the other platform would severely skew the results, invalidating any conclusions.