Dr. Mac’s Rants & Raves
Episode #235
My MacBook Pro has been running more reliably than ever the past few years. It usually runs 24 hours a day, seven days a week. And, it often runs for weeks (or months) without a hiccup (or a restart or shut down for that matter). I occasionally have to force a recalcitrant program to quit (Command + Option + Esc). But, I really can’t remember the last time my Mac crashed or froze and caused me to reboot.
I have to give some of the credit to Apple, which has made macOS more reliable and stable with each release. But I also have to give some of the credit to myself. See, I take it upon myself to monitor the handful of critical bits of information about my Mac that help me insure it continues to run smoothly.
Show Me the Important Stuff
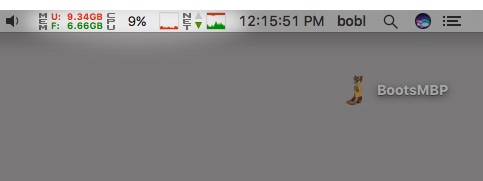
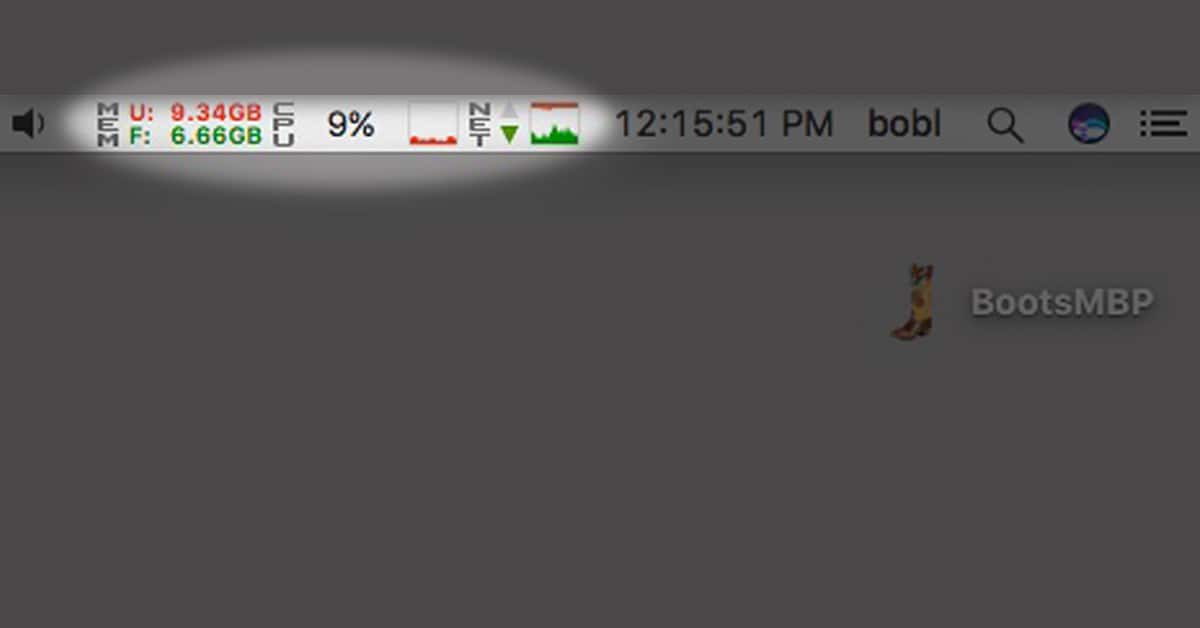
For me, the most important metrics are CPU, RAM, and network usage, which I monitor in real time with iStat Menus ($18). So, my current RAM usage and availability; current and historical CPU load; and incoming and outgoing network traffic are always visible in the menu bar, using only a tiny bit of my precious screen real estate.

The reason this is so important is that I can see when CPU, RAM, or network activity are higher-than-usual and take steps to address the issue before it becomes a problem.
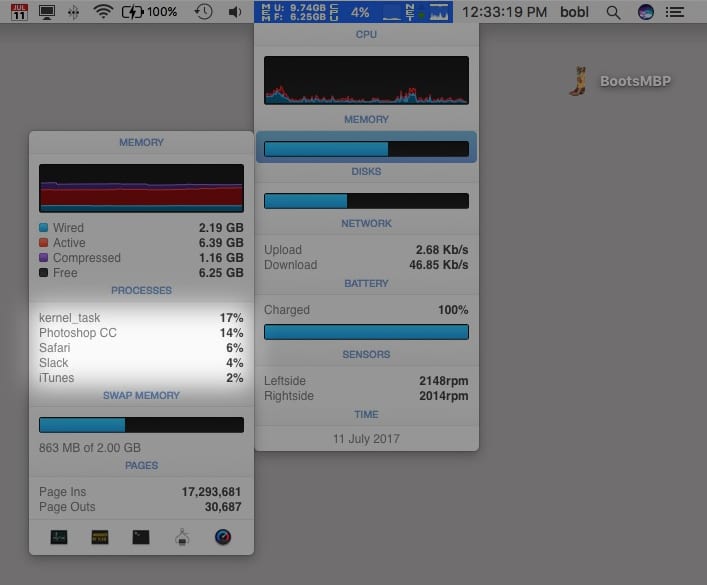
For example, when RAM gets full everything slows down. So, if I see that I’m running low on available (free) RAM, I click iStat Menus in the menu bar to display the apps currently using the most RAM in its drop-down menu. Then, I quit any and all RAM-hogging apps (I’m looking at you, Photoshop CC) I can live without for the moment.

Here’s another example: If I see my CPU spike to 70 or 80% (from its usual “light workload” average of 5 to 20%), I click iStat Menus in the menu bar, which shows me which apps are hogging up the processor so I can take appropriate action.
Show Me More
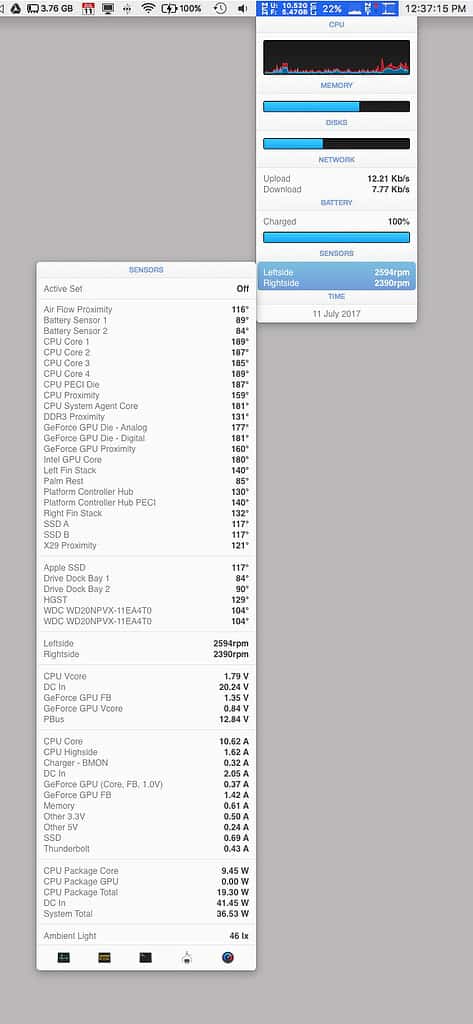
Finally, although I don’t feel the need to monitor them in real time, I like to occasionally see the temperatures of my MacBook Pro’s components and the speeds at which the internal fans are spinning, both of which are available (where else?) in iStat Menus’ drop-down menu.

While you can view some of this information in macOS’s bundled Activity Monitor app (in Applications/Utilities), its main window takes up WAY more screen space than iStat Menus compact menu bar display. And, you can’t see your CPU, Memory, and Network statistics at the same time. In Activity Monitor each is on its own tab, which means more clicking than I like.
iStat Menus is among the first things I install on all of my Macs. There’s a free 14-day trial, so give it a shot—it might just save your bacon.
Resources
iStat Menus. $18. Bjango.

AdriftMac:
I know! iStat Menus does so much that can help you before something bad happens. And it’s so flexible – you can set the menu bar to display as much or as little as you like, with lots of options for each display.
I don’t like to use a Mac without it. 🙂
I’ve been finding this app to be so helpful also. I use a 2012 Mac mini as my main computer and its fan doesn’t come on much for some reason even when I am doing heavy CPU work. So now I can manually set times when it should come on or do it manually myself just to make sure its being properly cooled. I have it show my core CPU temps and fan RPM’s. My computer is getting old and it would help me see when my fan stops working if it ever did die also.