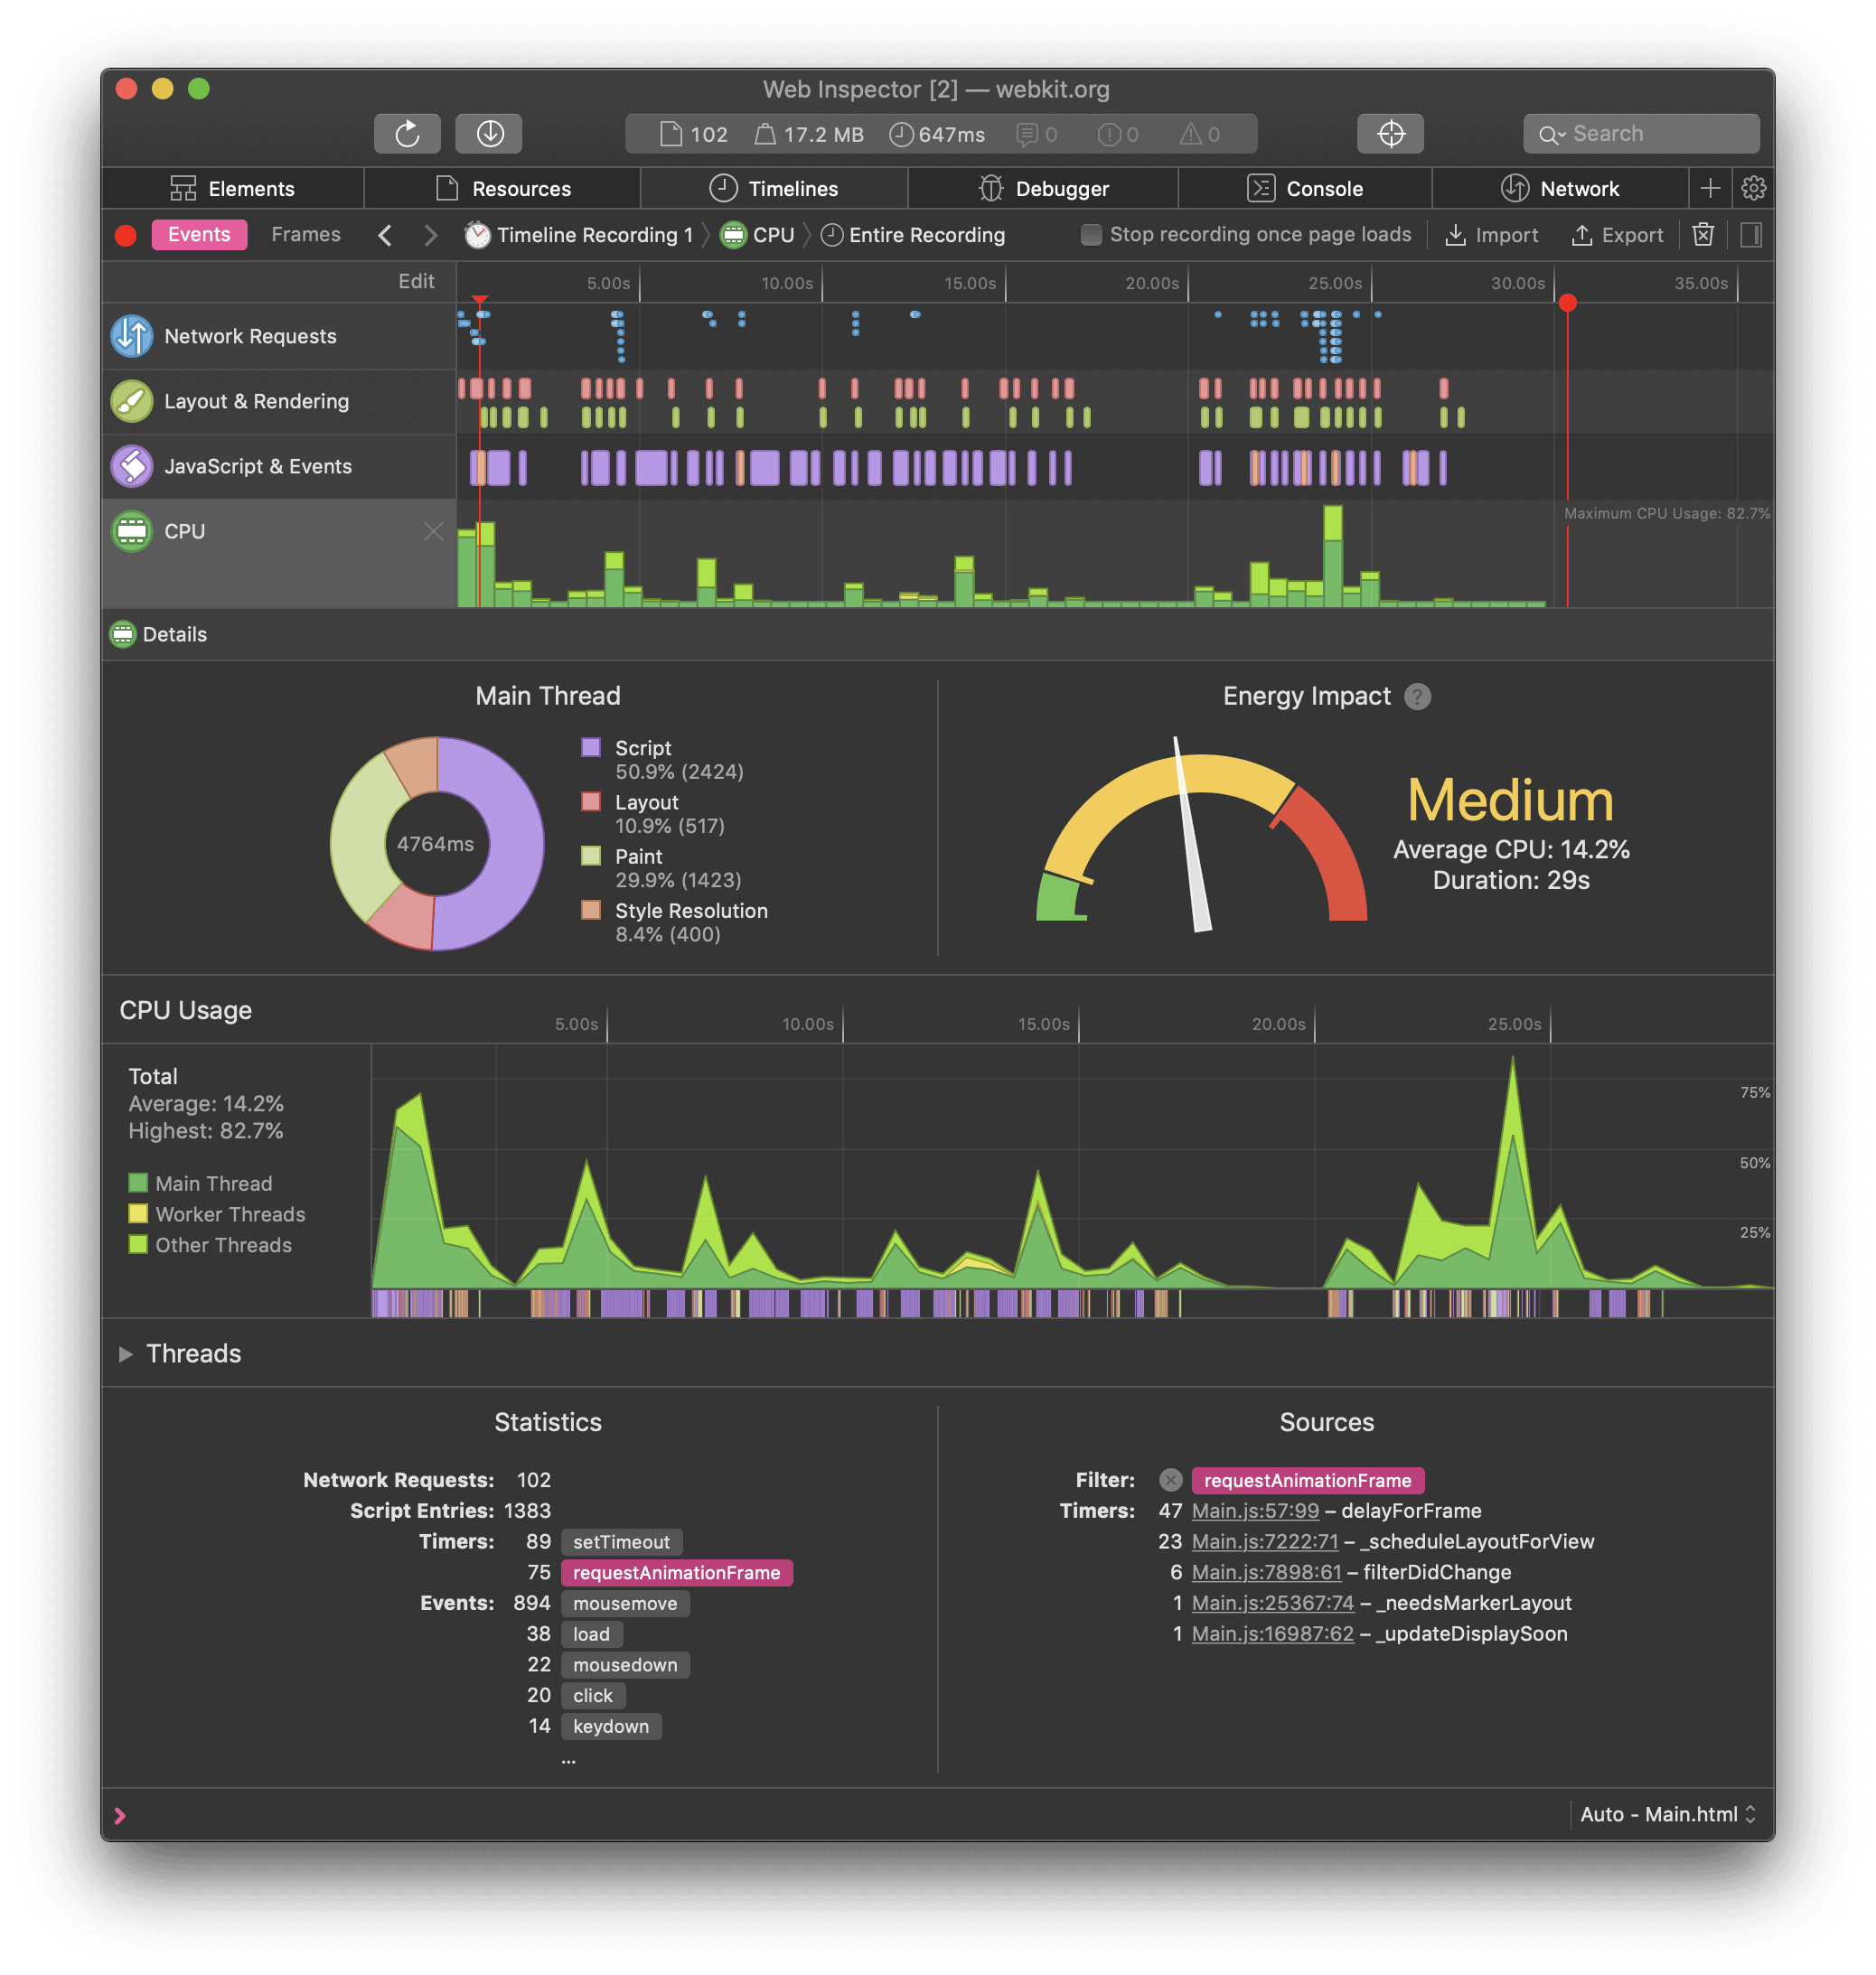
Safari 13 is adding a CPU Timeline to Web Inspector. This lets web developers measure the CPU usage of a page, estimate the energy impact, and identify where code can be improved to save power.
CPU Timeline
The new CPU Timeline is enabled by default. Open the Timelines tab of Web Inspector to see visual charts of how a particular web page utilizes CPU resources. This include main thread activity, an energy impact rating, and more.

The CPU samples are taken every 500 milliseconds. The first section gives you a breakdown of the work that the main CPU thread is doing. Principal tasks like evaluating script, painting, layout, and style resolution are performed on the main thread.
You can import and export timeline recordings to share in a bug report or save for further analysis. CPU Timeline is available in the latest Safari Technology Preview.
Further Reading:

Make ads static, no javascript and such?