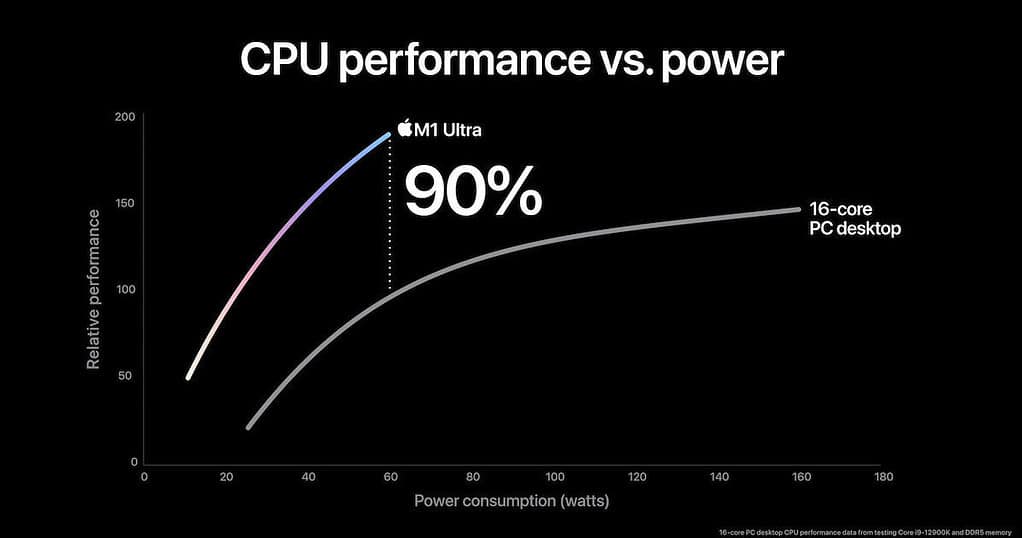
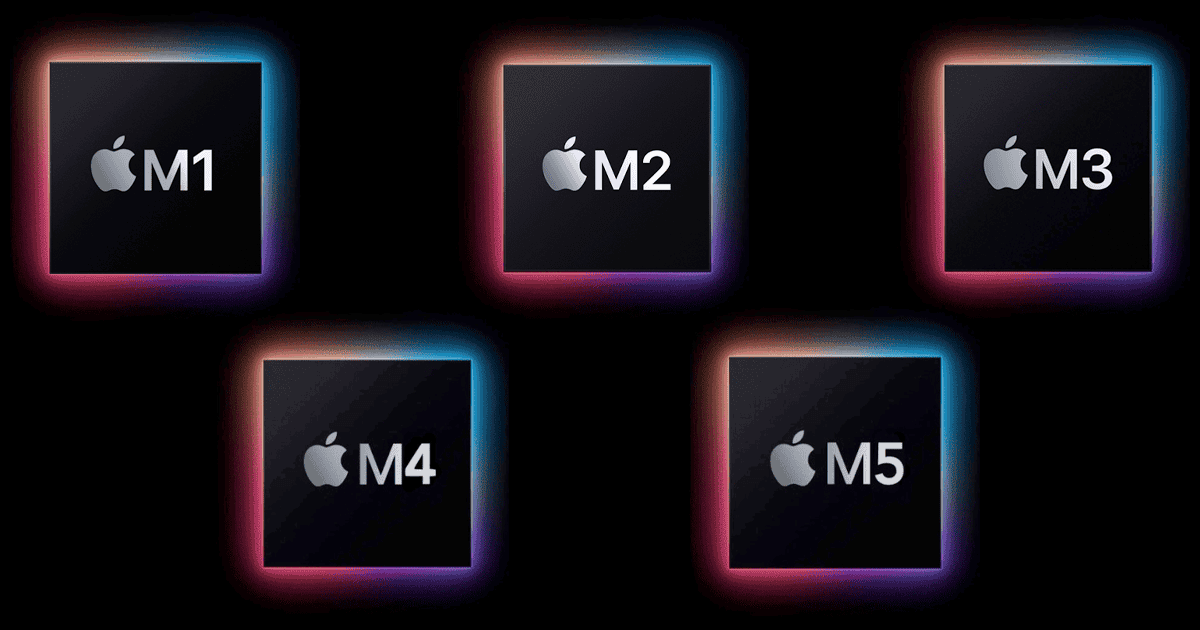
When the first M-series CPUs arrived in 2020, they blew Intel, AMD, and Qualcomm processors out of the water. Qualcomm has closed the gap a bit in recent years, but the other companies haven’t. But how do Apple’s chips compare to each other? Here are some benchmark test scores for M4, M3, and M2 models, and what speeds to expect from M5 models.
Comparing Apple Silicon Chips: Speed Tests for M5, M4, M3, and M2
Because of Apple’s bold performance claims, benchmarks pop up all over the tech media whenever a new chip arrives. While test results for M5 processors will only be available when they’re officially announced, we can make some educated guesses.
Test Parameters

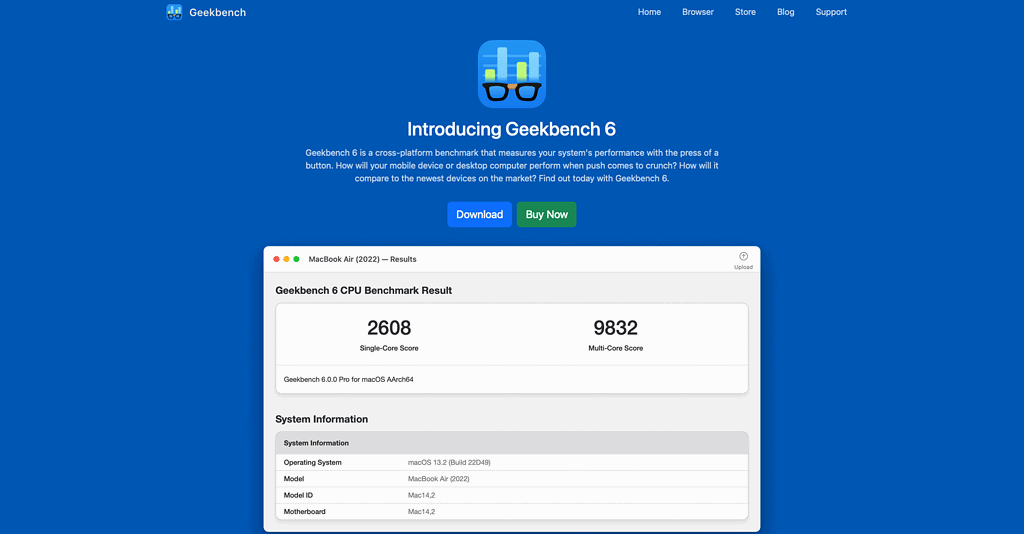
A fair comparison can only be reached through standardization. Currently, the closest you can get to that is using Geekbench, which performs separate CPU and GPU tests.
The tests were separated between CPU and GPU. Lastly, I used values listed in EveryMac, a database of Apple devices that has been active for almost 30 years. EveryMac updates its numbers according to the average listed on Geekbench’s own scoreboard.
CPU Parameters
Whenever available, Geekbench 5 scores were used. However, some newer Macs only have Geekbench 6 scores listed.
For these units, the results were normalized. Numbers were multiplied by the average difference between v5 and v6 in previous generations of the same processor model. Mac devices that required normalization have a note indicating that.
GPU Parameters
The GPU tests were trickier. Geekbench 5’s results are unreliable for cards with more than 32 cores, which is the case for many models. Therefore, Geekbench 6 was used for GPU comparison.
Also, some newer models didn’t have their average results listed. In these cases, I took the six most recent entries for each model and calculated their average.
Apple Silicon Chip Confusion: Same Name, Different Processor
There’s also the matter of differences among same-name processors. A base-model M3 chip, e.g., can have 8, 9, or 10 GPU cores. Similarly, an M2 Pro is available with 10 CPU and 16 GPU or 12 CPU and 19 GPU cores. To make things worse, each of those can be configured with multiple memory amounts.
To keep things streamlined, I have decided to use the following approach:
- “Vanilla” processors: base-model (13-inch) MacBook Air, to reflect the “worst” performance you can get on an Apple Silicon Mac
- “Pro” chips: maxed-out 16-inch MacBook Pro, the highest speed a mobile Mac can offer
- “Max” CPUs: maxed-out MacBook Pro 16-inch, because it has Max models for all M-series generations. The Mac Studio didn’t get an M3 Max variant.
- “Ultra” models: maxed-out Mac Studio, for the same reason — the Mac Pro is only available with M2 Ultra chips. It’s important to remember that there’s no M4 Ultra processor yet.
Apple Silicon Benchmark Scores: CPU

Vanilla M4, M3, and M2
- M2: 1,903 single-core; 8,838 multi-core
- M3: 2,310 single-core; 10,695 multi-core
- M4: 2,605 single-core; 12,650 multi-core
“Pro” Apple Silicon CPUs
- M2 Pro: 1,940 single-core; 14,850 multi-core
- M3 Pro: 2,291 single-core; 15,044 multi-core
- M4 Pro: 2,851 single-core; 22,149 multi-core
 NOTE
NOTE
M4, M3, and M2 Max
- M2 Max: 1,964 single-core; 14,660 multi-core
- M3 Max: 2,329 single-core; 22,649 multi-core
- M4 Max: 2,932 single-core; 27,637 multi-core
 NOTE
NOTE
Ultra Variant
- M2 Ultra: 2,013 single-core; 28,242 multi-core
- M3 Ultra: 2,388 single-core; 41,856 multi-core
M4, M3, and M2 Tests: GPU

On Geekbench for Mac, tests can be performed using either OpenCL or Metal APIs. Usually, OpenCL is preferred, because results can be compared across platforms — Metal is an Apple-exclusive API. However, I favored Metal for this list, because it yields more truthful results when comparing only Apple devices.
Vanilla M4, M3, and M2
- M2: 42,036
- M3: 46,893
- M4: 52,347
 NOTE
NOTE
“Pro” Apple Silicon GPUs
- M2 Pro: 82,879
- M3 Pro: 79,040
- M4 Pro: 112,409
 NOTE
NOTE
M4, M3, and M2 Max
- M2 Max: 139,700
- M3 Max: 155,784
- M4 Max: 187,325
Ultra Variant
- M2 Ultra: 223,179
- M3 Ultra: 247,069
 NOTE
NOTE
Expectations for M5 Tests Based on M4, M3, and M2

With the above numbers at hand, we can try some mathemagic to guess plausible values for the M5 chips. Here’s what I did:
- For each variant, I divided the Geekbench score of a chip by the score of the previous generation’s equivalent. For this, I included the M1 models. If, e.g., a M3 XYZ variant scored 1,200, and the M2 XYZ scored 1,000, the result would be 1.2. If the M4 XYZ scored 1,800, the result (1,800 divided by 1,200) would be 1.5.
- Since there’s no M4 Ultra, I calculated this value by averaging vanilla, Pro, and Max values. M4 score divided by M3 score, M4 Pro score divided by M3 Pro, and M4 Max by M3 Max. Sum the three, divide by 3, and we get the average M4-over-M3 performance increase.
- With the performance gains between each generation calculated, I summed the three and divided by 3. This way, I found the average generational performance gain. Back to our hypothetical XYZ variant, let’s imagine the M2 XYZ was 10% better than the M1 XYZ. In this case, the performance gains would be 1.1 (M2-over-M1) + 1.2 (M3-over-M2) + 1.5 (M4-over-M3). The sum of these is 3.8, which, divided by 3, results in about 1.27. This is the average generational performance gain.
- Lastly, I multiplied the M4 generation score by the average generational performance gain. The result is a likely value, with some margin, for the M5 generation score. Since there’s no M4 Ultra, I performed this operation with the M3 Ultra score. This way, I could find what would be a “hypothetical M4 Ultra” score.
- The procedure was performed for single and multi-core CPU scores and for the GPU score.
Possible Benchmark Results for M5 Apple CPUs
With the above calculations, we could expect the approximate M5 generation Geekbench scores to be:
- Vanilla M5: 3,018 single-core; 15,248 multi-core; 63,039 GPU
- M5 Pro: 3,365 single-core; 27,399 multi-core; 134,673 GPU
- M5 Max: 3,483 single-core; 36,427 multi-core; 220,165 GPU
- M5 Ultra: 3,330 single-core; 73,846 multi-core; 382,200 GPU

There’s no way to know for certain how fast Apple’s next CPUs will be. However, we can use the speeds of M4, M3, M2, and even M1 chips to guesstimate the M5’s performance.
While this is by no means a sure bet, it can at least be a fun fortune-telling exercise. Or, perhaps, Apple can surprise us all and reveal even faster chips than expected.
